Methodology
Benefits
Mapping tree canopy helps local governments understand and manage urban forests. These maps are key components of urban tree canopy assessments , which provide the information needed to protect tree health, plan drainage, detect pests, and enhance both biodiversity and community life.
Data Sources
Canopy mapping can be performed at scales ranging from city-wide surveys to individual trees. High-resolution imagery combined with lidar typically provides the most precise and detailed maps and captures subtle variations in canopy structure that coarser data often miss.
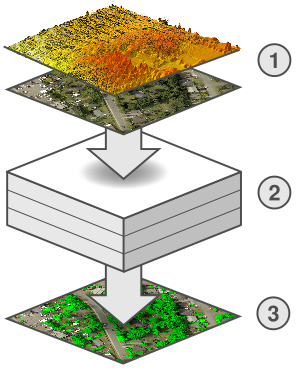
Steps in the canopy mapping process
- Input layers: Lidar point cloud (and derivatives) and orthographic imagery.
- Intermediate layers: Spectral, structural, and textural indices derived from the input data.
- Output layer: A specialized AI model integrates the intermediate layers to produce a pixel-based canopy map.
Further analyses, such as tree-level detection, delineation, and classification (see below), are performed using this canopy map.
Individual Tree-Level Analysis
Mapping out the extent of an urban tree canopy is often only the first step. Individual trees can be detected and delineated using a variety of specialized tools and algorithms (ex.: ForestTools). This, in turn, enables a wide range of analyses and insights.
Measurements like stem height or crown volume can be extracted from lidar. Trees can be classified based on their spectral or structural characteristics. Groupings could include health status or whether they are coniferous or deciduous. In some cases, it is even possible to achieve classification at the species level.
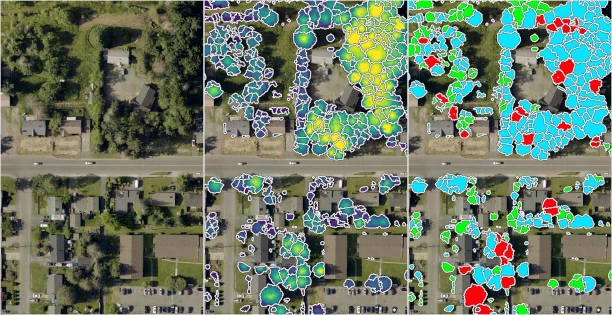
(red = dead, blue = coniferous, green = deciduous).
Previous Work
Since 2013, Andrew has produced high-resolution canopy maps in the following communities in Canada and the United States.
Future Direction
The tools available for canopy mapping are evolving rapidly. While Andrew's previous work relied heavily on traditional machine learning techniques for classifying imagery and lidar data (ex.: segment-based classification using randomForest), these approaches are being gradually supplanted by more sophisticated tools.
Neural networks are able to incorporate deeper contextual information and be applied to a wider range of complex, heterogenous environments. This page will be used to discuss and share future work in developing models for canopy mapping.
Research
Some publications on mapping tree canopy which Andrew has authored or to which he has contributed:
Forestry: An International Journal of Forest Research
Apr 27, 2023
International Journal of Remote Sensing
Nov 25, 2019
IEEE Journal of Selected Topics in Applied Earth Observations and Remote Sensing
Oct 1, 2019
International Journal of Wildland Fire
Aug 13, 2019
Remote Sensing of Environment
Apr 15, 2017
Frontiers in Plant Science
Oct 21, 2016
Urban Forestry & Urban Greening
Jul 2, 2016