Geospatial AI
Overview
With over a decade of experience developing and applying AI models to analyze remote sensing data, Andrew has helped clients use AI to classify land cover, automatically identify features of interest, and monitor landscape changes.
Examples
- Custom neural networks for analyzing geospatial data
- Development of tools and workflows for training and improving models
- Application of models to large remote sensing datasets
Sample projects
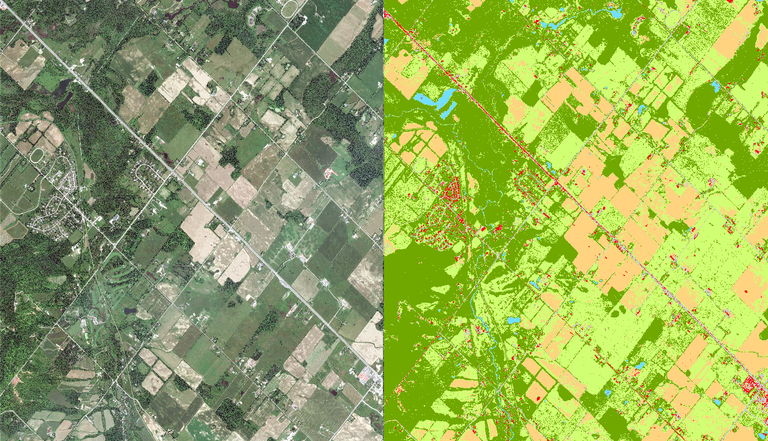
Land cover classification
Regional Municipality of Peel, Ontario
Developed and applied a supervised learning model for mapping six classes of land cover using Pleiades high-resolution imagery.
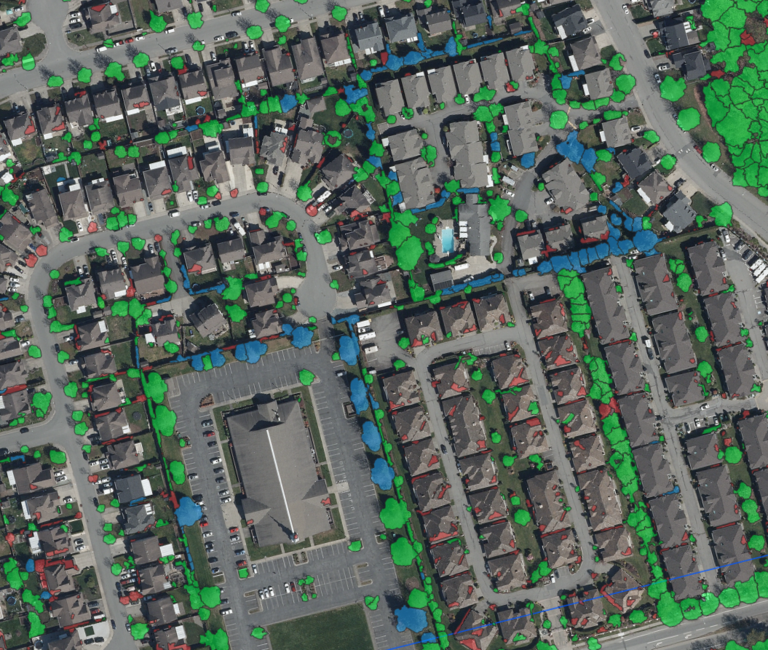
Urban canopy mapping
Abbotsford, British Columbia
Used high-resolution aerial imagery and lidar to map urban canopy and identify and measure individual trees in over twenty cities across Canada and the United States.
See Canopy Mapping page for more details.
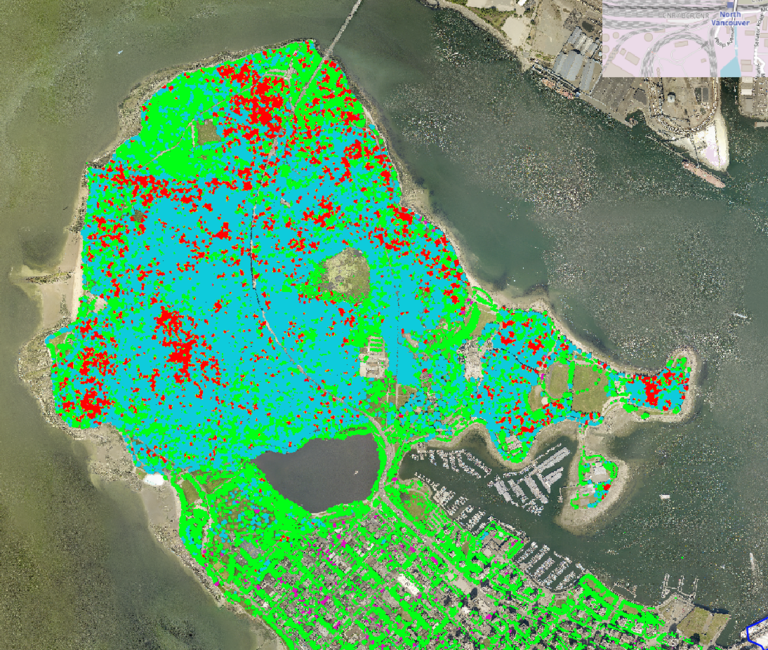
Detection of vegetation mortality
Vancouver, British Columbia
Designed a remote sensing model that leverages spectral reflectance patterns and lidar point cloud metrics for detecting tree mortality caused by the 2019-2020 hemlock looper moth outbreak.
Web Development
Overview
From simple web map embeds to full-featured mapping platforms, Andrew combines modern web frameworks with solid GIS expertise to create clear, intuitive interfaces for exploring and using spatial information.
Examples
- Interactive web maps using Leaflet, Mapbox, or OpenLayers
- Spatial database design and management (e.g., PostGIS, SpatiaLite)
- Integration with satellite imagery and other remote sensing data
- API development for geospatial data
- Automation of spatial workflows (e.g., tiling, reprojection, analysis)
- User-friendly dashboards and reporting tools
Sample projects
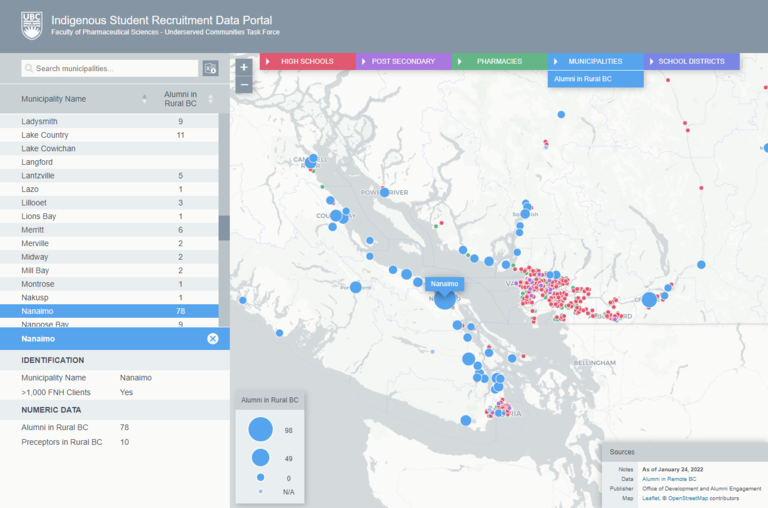
Indigenous Student Enrollment Tracker
UBC Faculty of Pharmaceutical Sciences
Interactive web application for tracking and facilitating the enrollment of Indigenous students.
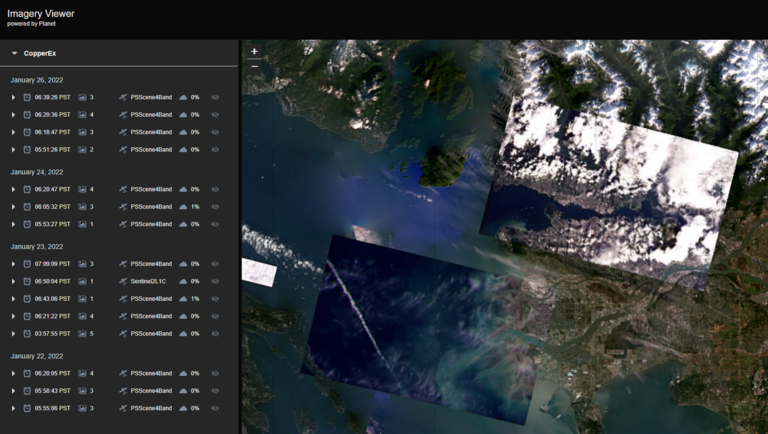
Satellite Imagery Catalog
Web application for querying, previewing, and consulting technical specifications for satellite imagery prior to purchase.
Data Analysis
Overview
Andrew offers services related to analyzing and processing satellite imagery, aerial photography, lidar, vector data, and field observations. He works mainly with open-source geospatial tools, allowing clients to easily build on the work without being locked into proprietary software or ongoing licensing costs.
Examples
- Satellite and aerial imagery analysis
- Lidar and elevation data processing (e.g., terrain modeling, canopy height mapping)
- Custom geoprocessing workflows (e.g., scripting and automation with Python, GDAL, and QGIS)
Sample projects
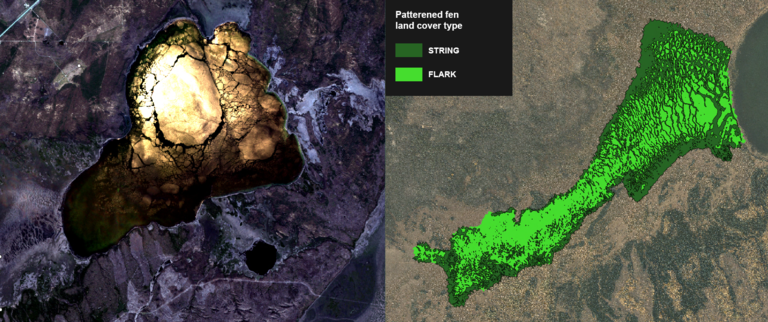
Wetland Monitoring and Vegetation Mapping
McClelland Lake, Alberta
Used lidar and Sentinel-2 imagery to map vegetation cover and monitor water levels in a boreal wetland complex.
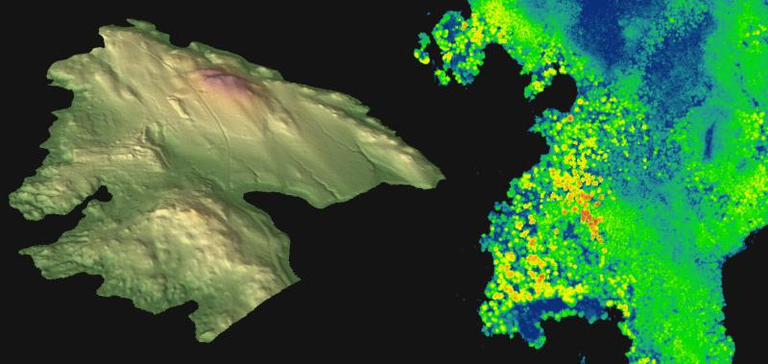
Identifying Conservation Targets
Ucluelet, British Columbia
Mapped tree canopy height and identified key conservation targets based on tree structure and spatial distribution using airborne lidar data.
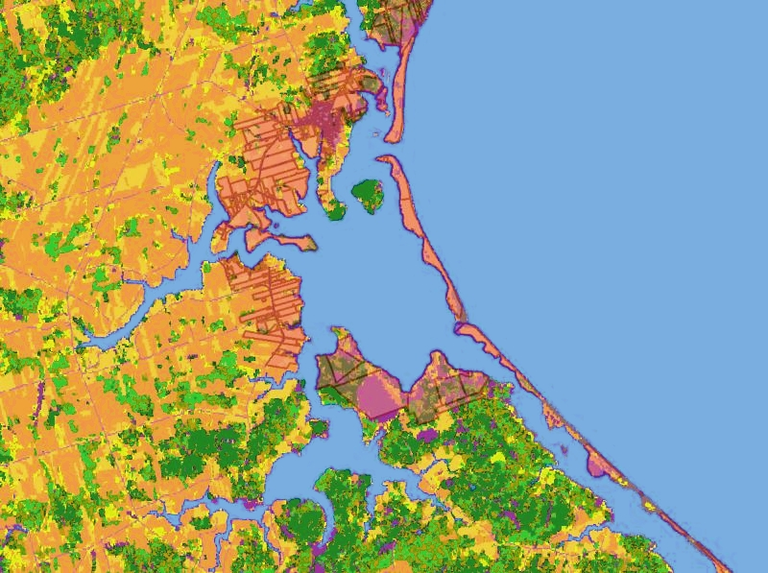
Land Parcel Suitability Analysis
Nature Canada
Identified land parcels for purchase within critical bird habitat in Atlantic Canada using land cover and environmental data.
Data Visualization
Overview
Presenting information clearly increases its impact. Andrew creates visually compelling maps, graphics, and animations that blend strong design with geospatial and analytical expertise.
Examples
- Eye-catching maps and infographics
- Interactive web-based visualizations
- Geospatial data animation in 3D (Blender)
Sample projects
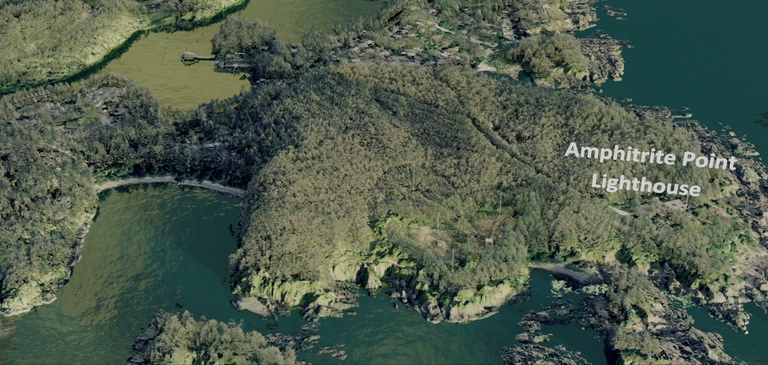
3D Flood Scenarios
Ucluelet, British Columbia
Animation of multiple flooding scenarios using lidar, aerial photography, and hydraulic modeling data. Part of a public safety engagement campaign to visualize tsunami hazards.
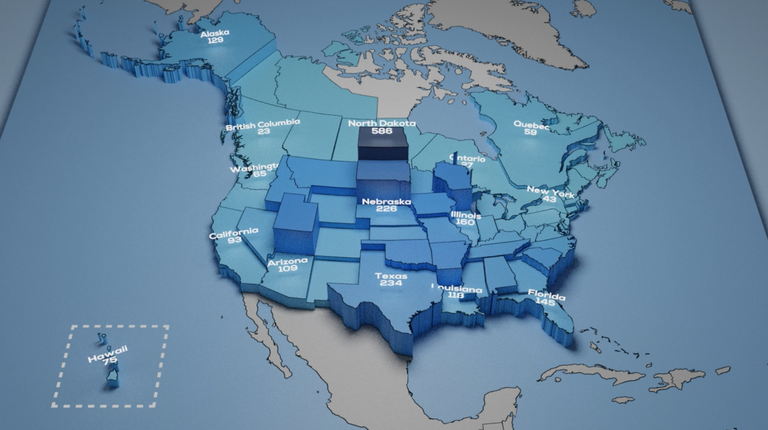
Animated Data Storytelling
Annotated 3D animation of the COVID-19 pandemic's spread across North America.
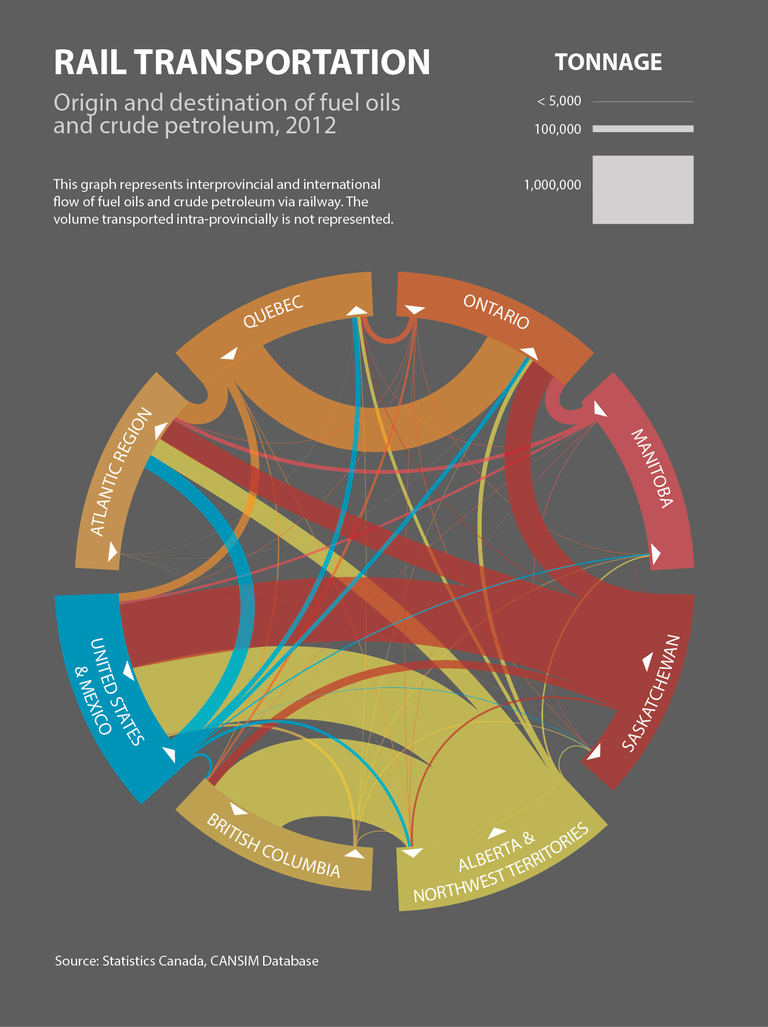
Flow Diagram
Parliamentary Information and Research Service (Canada)
Visualization of the international and interprovincial flow of fuel oils and crude petroleum.
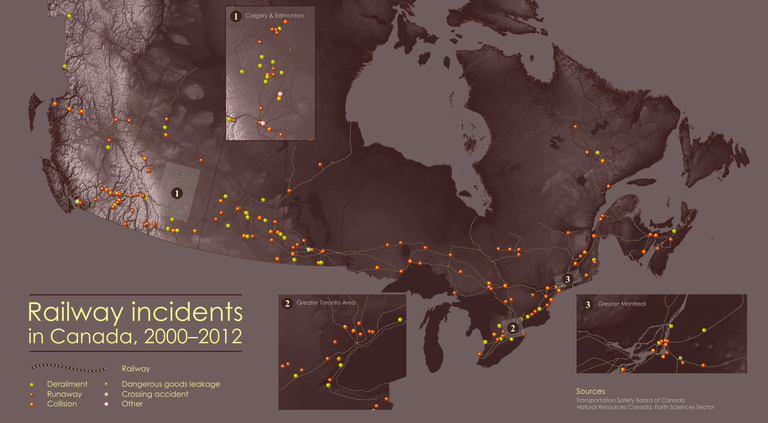
Cartography
Parliamentary Information and Research Service (Canada)
Map of railway incidents involving dangerous goods in Canada between 2000–2012. Part of a parliamentary report on the transportation of hazardous materials.
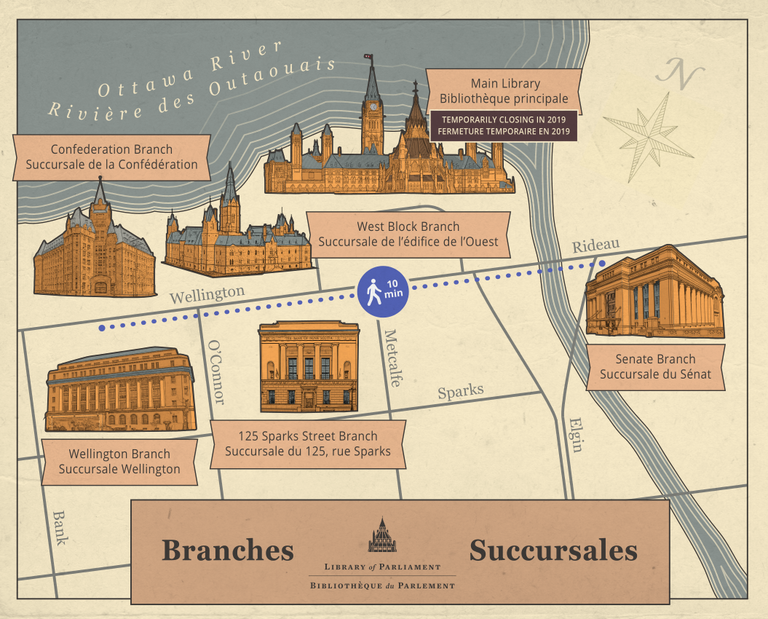
Illustrative Map
Library of Parliament (Canada)
Illustrative map of the branches of the Canadian Library of Parliament located in Ottawa, Ontario.